 |
Опрос на сайте |
 |
 |
| На какой валютной паре вам удается зарабатывать больше всего? |
|
 |
 |
 |
 |
|
 |
| |
|
|
 |
Категория: For international users, Library |
|
 |
 |
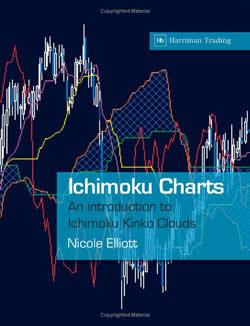
Nicole Elliott: "Ichimoku Charts: An Introduction to Ichimoku Kinko Clouds" 3 июля 2007, 21:02 |
 |
 |
 About the Author
A graduate of the London School of Economics and member of the Society of Technical Analysts, Nicole Elliott has worked in the City of London for 25 years. Trading, in sales and as an analyst within the Treasury departments of major international banks, Technical Analysis is always the backbone of her methodology. She is Mizuho Corporate Bank’s senior analyst in London and covers the foreign exchange, interest rate, commodity markets and equity indices.
Book Synopsis
 Candlesticks charts, although originating in Japan, now playan important role in technical analysis worldwide. Now, for the first timein English, this book presents the next stage of candlestick analysis - Ichimoku Kinko Hyo. Sometimes called Cloud Charts, this analysis addsmoving averages to candlestick charts. But moving averages a littledifferent from those traditionally used in the West. For trending markets,Cloud Charts add an essential tool for analysing near-term areas of supportand resistance. Candlesticks charts, although originating in Japan, now playan important role in technical analysis worldwide. Now, for the first timein English, this book presents the next stage of candlestick analysis - Ichimoku Kinko Hyo. Sometimes called Cloud Charts, this analysis addsmoving averages to candlestick charts. But moving averages a littledifferent from those traditionally used in the West. For trending markets,Cloud Charts add an essential tool for analysing near-term areas of supportand resistance.
The book covers the history of candlestick charts - explaining the contextin which they developed. And then moves on to explain how in the 1930s ajournalist, with the pseudonym Ichimoku Sanjin, started refiningcandlestick analysis by adding a series of moving averages. The bookexplains in detail how to construct Cloud Charts and how to interpret them.A chapter is devoted to the advanced analysis of Cloud charts, with anin-depth study of the Three Principles: Wave Principle, Price Target andTimespan Principle. The book is illustrated throughout with numerousexamples of Cloud Chart analysis.
Walk into any Japanese dealing room today and you will see that the mostcommon charts being used are Ichimoku Kinko Clouds. This book presents thedefinitive explanation of these charts for the first time to a Westernaudience.
Chapter 1: History
The book covers the history of candlestick charts - explaining the context in which they developed. It then moves on to explain how in the 1940s and 1950s a journalist, with the pseudonym Ichimoku Sanjin, started refining candlestick analysis by adding a series of moving averages. The book explains in detail how to construct Cloud charts and how to interpret them. A chapter is devoted to the advanced analysis of Cloud charts, with an in-depth study of the Three Principles: Wave Principle, Price Target and Timespan Principle. The book is illustrated throughout with numerous examples of Cloud chart analysis.
Purchase the book
|
 |
 |
|
 |
 |
|
|
 |
 |
Уважаемый посетитель, Вы зашли на сайт как незарегистрированный пользователь. Мы рекомендуем Вам зарегистрироваться либо зайти на сайт под своим именем.
|
 |
|
 |
|

